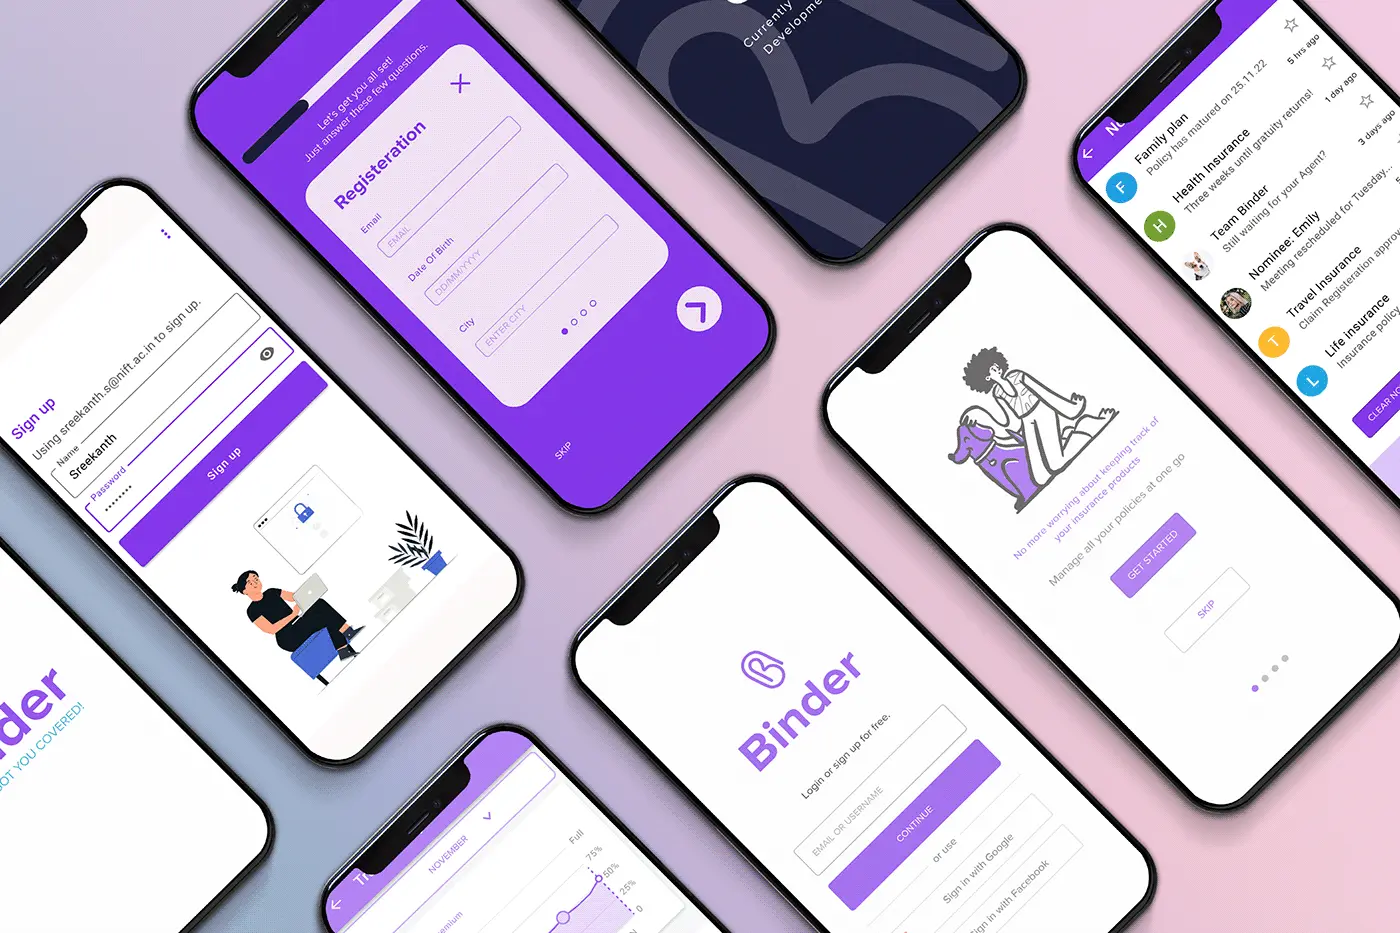
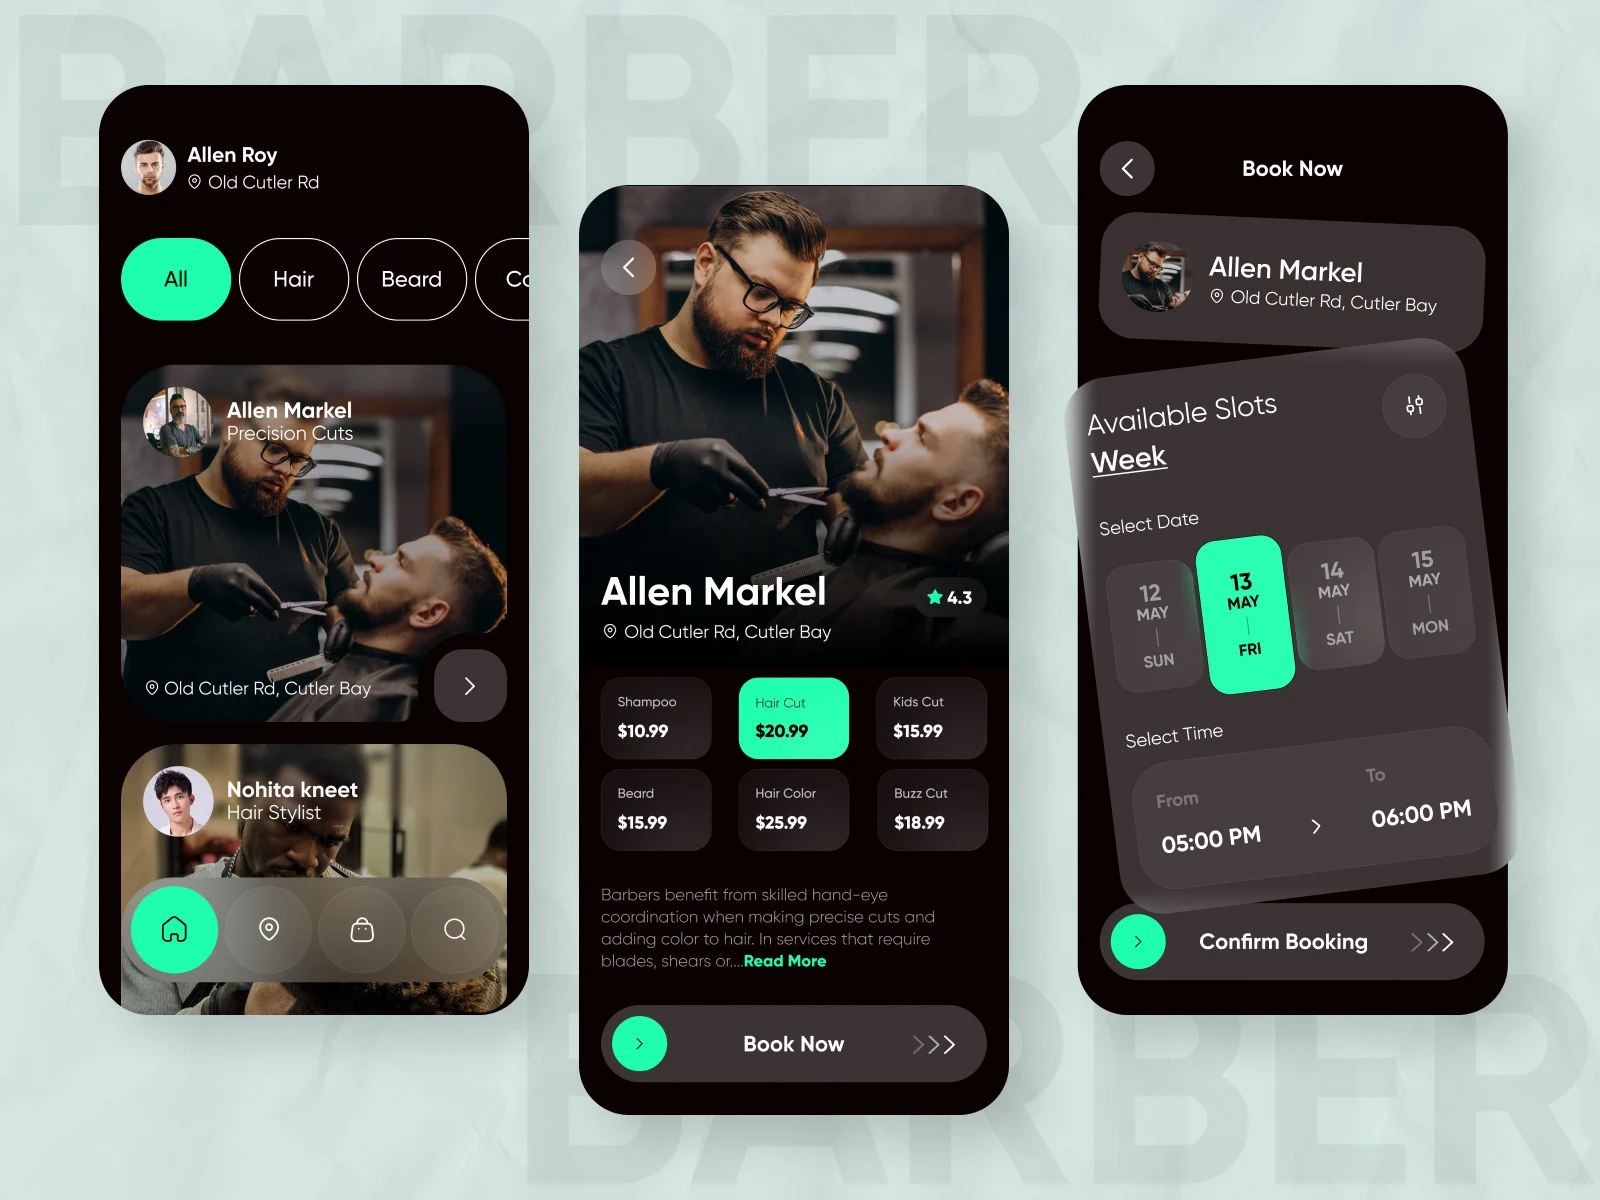
Mobile App Development
Build custom iOS and Android apps that engage your users and drive growth.
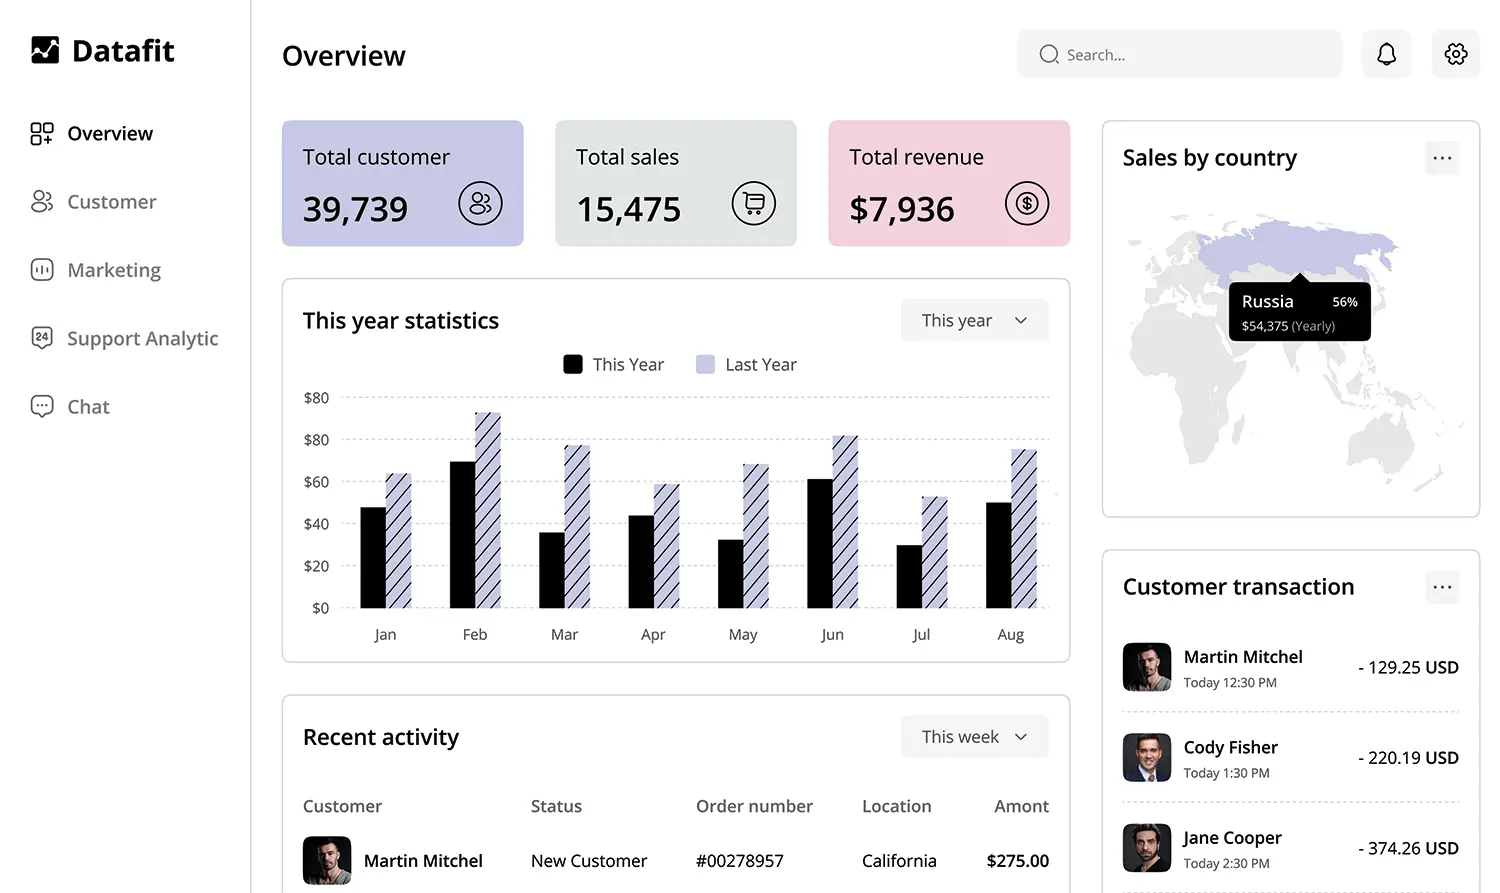
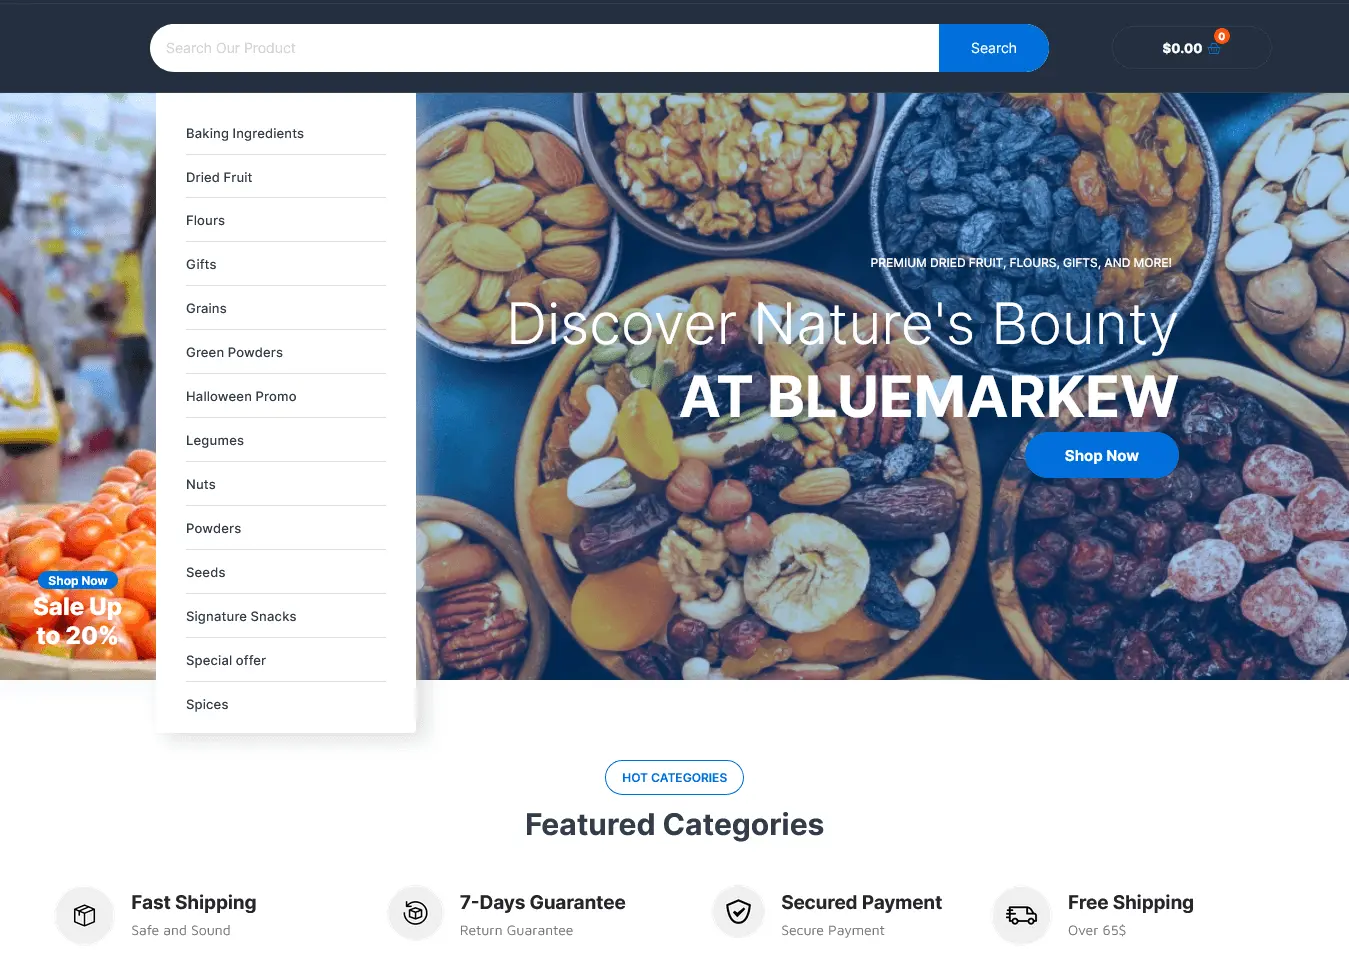
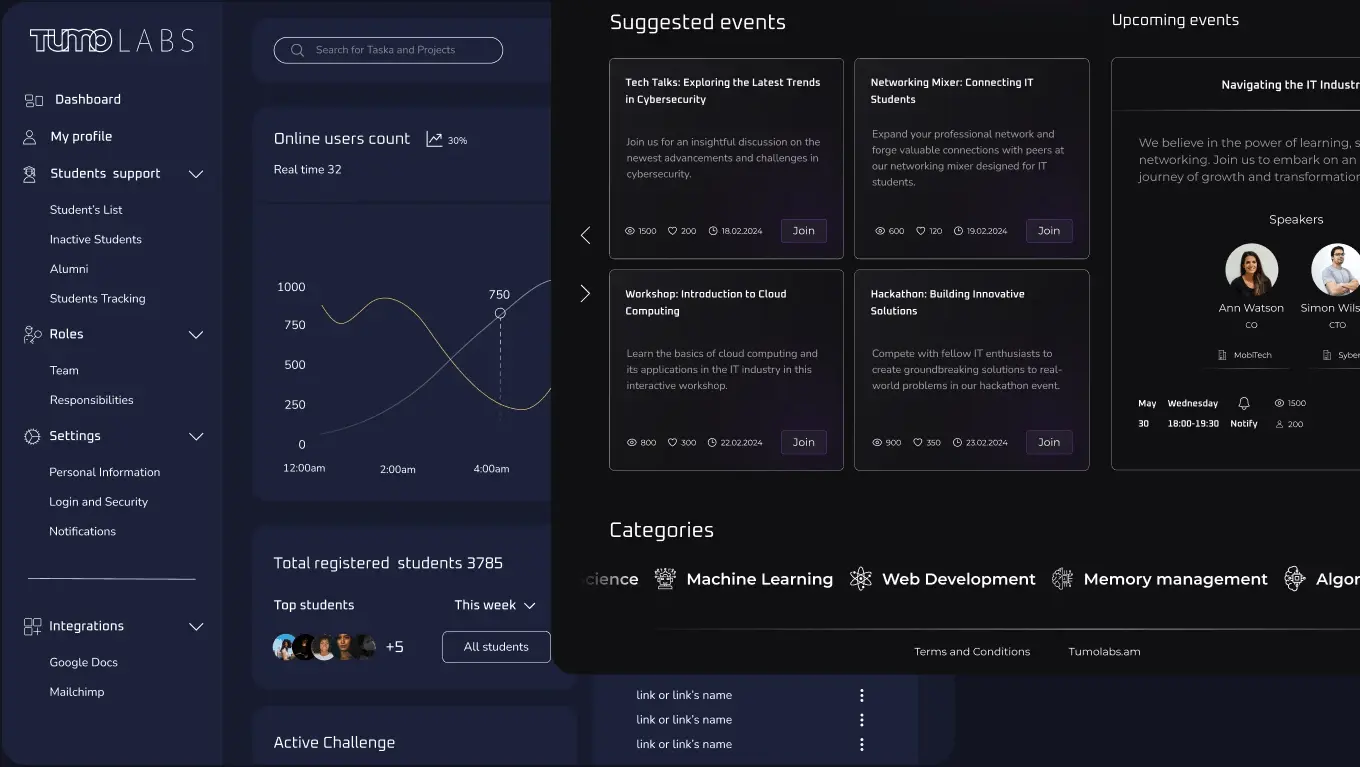
Web App Development
Develop scalable, secure web applications tailored to your business goals.
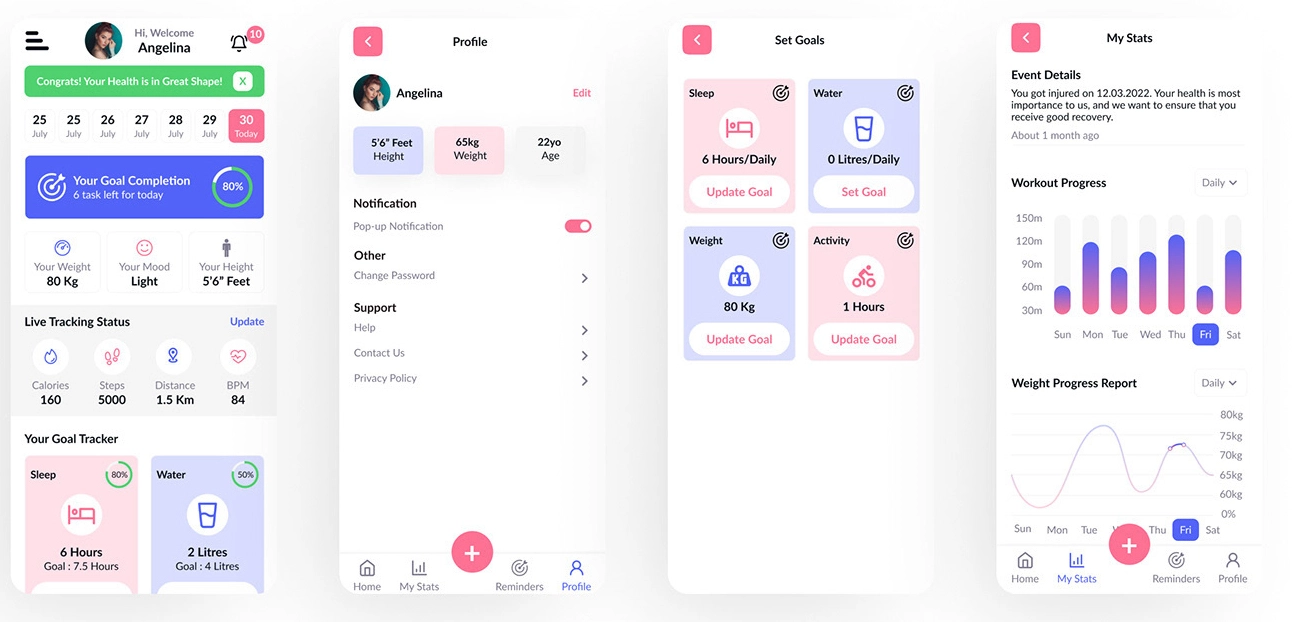
UI/UX Design
Create intuitive, user-friendly designs that delight and retain customers.
MVP Development for Startups
Launch your minimum viable product quickly to validate your idea and attract investors.
Maintenance & Support
Keep your apps updated, secure, and performing smoothly with ongoing support.
Mobile App Development
Build custom iOS and Android apps that engage your users and drive growth.
Web App Development
Develop scalable, secure web applications tailored to your business goals.
UI/UX Design
Create intuitive, user-friendly designs that delight and retain customers.
MVP Development for Startups
Launch your minimum viable product quickly to validate your idea and attract investors.
Maintenance & Support
Keep your apps updated, secure, and performing smoothly with ongoing support.
Loading...